Stock Footage & Audio Subscription Payback Calculator
Calculate whether an unlimited stock media subscription is worth it compared to buying assets individually. Factor in mixed-asset costs, commercial licensing, and the hidden value of the time you save.
Subscription & License Details
Expected Usage & Valuation
Estimate your exact media mix per video (e.g., $79 for stock footage, $2 for an SFX).
"Time is Money" Value
Estimate how many hours you save by using one unified library instead of hunting across 5 different stock websites.
Annual Value Breakdown
-- / asset
This is what each asset actually costs you under the unlimited subscription plan based on your volume.
Break-Even & Usage Metrics
Paying for an unlimited stock media subscription feels smart, but how long does it actually take to recover that cost? This free payback period calculator shows you the exact break-even point, your hard cash savings, and the total ROI of your subscription against buying assets individually.
This tool computes the amount of time it takes to recover your total subscription cost based on your real usage volume, asset mix, commercial licensing tier, and the time value of your own hourly rate. It supports platforms like Envato Elements, Epidemic Sound, Artlist Max, and Motion Array, and converts your savings into 20+ global currencies.
What the CAC Payback Period Metric Actually Measures for Creators
Every video producer, freelancer, or agency faces the same decision: pay a flat annual fee for unlimited assets or buy each clip, track, and graphic individually. The problem is that the math is never obvious upfront.
The payback period measures how long it takes your subscription to earn back the cost of acquiring it through the value of assets you consume. In SaaS and growth marketing, the CAC payback period is used to evaluate the efficiency of customer acquisition strategies. For creative professionals, the same logic applies: your subscription is the investment, and every asset you use is the return on acquisition.
A shorter payback period means faster profitability. A longer payback period signals either over-pricing, under-usage, or a misaligned asset mix. This calculator makes that invisible number visible so you can make smarter financial decisions before committing to any subscription business model.
For teams managing a marketing budget, understanding the time to payback CAC on creative tooling is just as important as tracking conversion rate or lifetime value from paid campaigns.
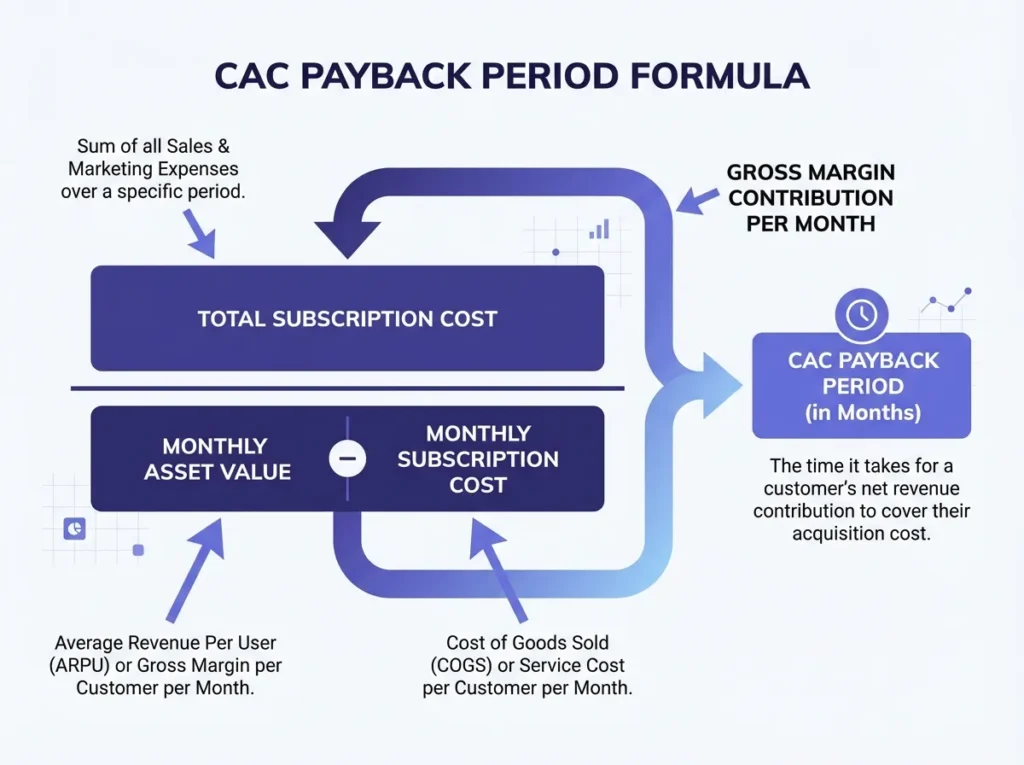
The Payback Period Formula and How This Tool Calculates It
The core payback period formula used here is:
Payback Period (Months) = Total Annual Subscription Cost / Monthly Net Asset Value
Where:
Monthly Net Asset Value = (Avg Assets per Video x Videos per Month x Avg Cost per Asset) – (Subscription Cost / 12)
For advanced mixed-asset valuation, the tool calculates separate cost-per-asset streams for stock footage, music tracks, and SFX/graphics, then sums them. This models your real media mix rather than assuming a single flat asset price, which is where most generic calculators fail.
The “Time is Money” layer adds your hourly value multiplied by hours saved per month, converting time efficiency into a hard cash equivalent. This accounts for the time value of money in practical terms (how much your search and licensing hours actually cost you).
The break-even formula is:
Assets Needed to Break Even = Total Annual Subscription Cost / Avg Cost per Asset
Full results include hard cash savings, effective cost per asset, total value (cash + time), and the payback period in months. For multi-currency reporting, a live exchange rate converts the final savings figure.
If you work on subscription revenue models or track sales and marketing spend professionally, you can also connect this to your broader CAC ratio analysis using the Video Thumbnail Designer A/B Testing ROI Calculator to measure creative performance downstream.
When This Calculation Doesn’t Apply: If you use fewer than 5-7 assets per month across all categories, the payback period extends well beyond 12 months and the subscription is unlikely to be cost-efficient versus selective individual purchases. The tool will show this accurately, but the decision to subscribe should factor in future usage growth, not just current volume.
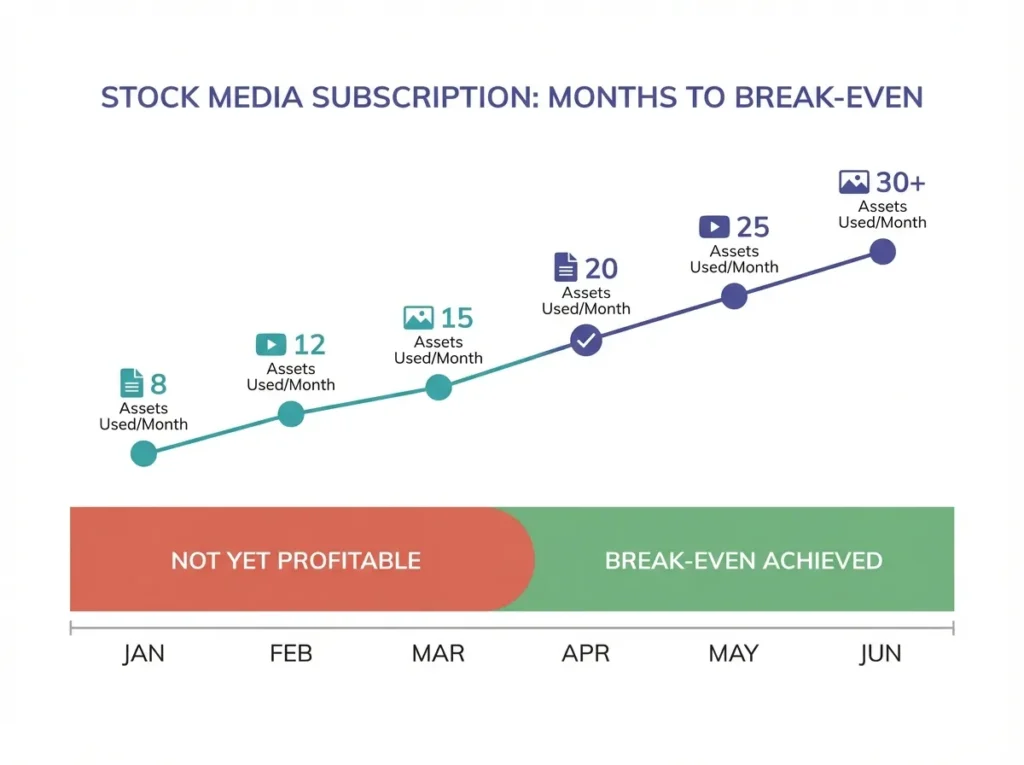
Stock Media Subscription Payback Benchmarks by Usage Tier
Standard Stock Media Subscription ROI Reference Values by Monthly Asset Volume
| Monthly Videos Produced | Approx. Assets Used/Year | Typical Payback Period | Subscription Verdict |
|---|---|---|---|
| 1-3 videos | 60-180 assets | 6-12+ months | Borderline, review asset mix |
| 4-8 videos | 240-480 assets | 2-5 months | Profitable for most platforms |
| 10-20 videos | 600-1,400 assets | Under 1 month | Highly profitable |
| 20+ videos (agency) | 2,000+ assets | Near-instant | Strong positive ROI |
| Editor team (multi-seat) | 3,000+ assets | Under 2 weeks | Max ROI with team licensing |
These benchmarks are based on standard individual asset pricing across major stock platforms. Your effective cost per asset and total cash savings will shift depending on your asset mix, commercial license tier, and whether you include multi-seat pricing.
Freelancers handling client deliverables should also calculate their YouTube Merch & POD Profit Margin alongside this tool to understand full production profitability per client project.
Scenario: A Freelance Video Editor Running 20 Projects Per Month
Meet Layla, a freelance video editor producing 20 client videos per month. She uses Envato Elements with a Commercial/Client Work License and a Multi-Seat/Editor Team License, paying $228/year.
Her asset mix per video: 100 stock footage clips at $50 each, 50 music tracks at $15 each, and 10 SFX/graphics at $3 each.
Step 1: Monthly individual cost
- Stock footage: 100 x $50 = $5,000
- Music tracks: 50 x $15 = $750
- SFX/Graphics: 10 x $3 = $30
- Total per video: $5,780
- x 20 videos = $115,600/month individual cost
Step 2: Annual individual cost $115,600 x 12 = $1,387,200/year
Step 3: Hard cash savings $1,387,200 – $228 = $1,386,972 saved annually
Step 4: Time savings Hourly rate $40 x 30 hrs saved/month x 12 = $14,400/year in recovered time
Step 5: Total value (cash + time) $1,386,972 + $14,400 = $1,401,372
Assets needed to break even: 7 assets total (less than a single video’s worth of footage).
This matches exactly what the calculator outputs in Image 2. At that usage volume, the subscription pays for itself within the first project of the year.
Common Mistakes That Distort Your Payback Period Calculation
1. Using a flat average asset cost instead of a mixed-asset breakdown Stock footage typically costs $50-$79 per clip individually. Music tracks run $15-$30. SFX can be as low as $2-$5. Averaging all three together undervalues the subscription’s real benefit. Use the Advanced Mixed Asset Valuation toggle for accurate results.
2. Ignoring commercial licensing costs If you produce sponsored content or client deliverables, you need a Commercial/Client Work License. Skipping this tier means your effective cost of acquiring commercially-licensed assets is dramatically higher than a standard license, making the subscription even more valuable. Factor this into your calculation.
3. Not counting time as a cost Hunting across 5 separate stock websites costs real time. At $40-$100/hour, even 10 hours saved per month adds $4,800-$12,000 annually to your subscription’s ROI. The “Time is Money” inputs exist for this reason: use them.
4. Comparing monthly subscription cost to per-asset cost without annualizing Many creators compare a $19/month fee against a single $79 clip and think “not worth it.” The correct comparison is the annual cost vs. the total number of assets used in a year. This tool annualizes everything correctly so you see the full picture.
For creators also selling voiceover work or audio content, compare these results with your Voiceover Word Count Pricing Calculator to track the full cost and revenue side of your creative workflow.
According to Investopedia’s guide on payback period and discounted payback period, the standard payback period does not account for the time value of money, which is why projects with long horizons benefit from discounted cash flow analysis. This tool incorporates a time-value proxy through the hourly savings module rather than a formal discount rate, which is intentional: for subscription decisions under 12 months, the NPV difference is minimal and the simpler model is more actionable.
How to Use the Stock Footage Subscription Payback Calculator
The tool is split into two panels: Subscription & License Details (left) and Expected Usage & Valuation (right).
Left Panel – Subscription & License Details:
- Select your platform from the dropdown. Options include Envato Elements, Epidemic Sound, Artlist Max, Motion Array, or enter a Custom Subscription. Selecting a preset auto-fills the default subscription price.
- Check “Commercial / Client Work License” if you produce sponsored or client content. This adjusts to Pro/Commercial pricing tiers automatically.
- Check “Multi-Seat / Editor Team License” if you have editors working under your account. This adds team pricing to the total.
- Confirm or edit the Total Subscription Cost field. Choose /year or /month from the dropdown.
Right Panel – Expected Usage & Valuation:
- Enter your Videos Produced Per Month in the “vids” field.
- Toggle Use Advanced “Mixed Asset” Valuation to model separate asset types. Enter quantities and individual prices for Stock Footage, Music Tracks, and SFX/Graphics.
- Under “Time is Money” Value, enter your Hourly Rate (USD) and Hours Saved per Month to include time savings in the total ROI.
- Select your Target Currency for Savings from the dropdown (20+ currencies supported, including USD, GBP, EUR, INR, AED, and more).
Click Calculate Payback Period to generate full results. The output shows Total Value (Cash + Time), Annual Value Breakdown (hard cash savings, effective cost per asset), and Break-Even & Usage Metrics (assets needed to break even, months to break even, and converted total value in your selected currency).
Use the Print or Share buttons to save or distribute your results.
Why This Calculator Stays Accurate and Free
This payback period calculator is updated annually to reflect current standard stock asset pricing benchmarks and platform subscription tiers for 2026. It runs entirely in your browser: no sign-up, no data stored, no paywalls. The cac payback period formula used follows the same methodology applied in SaaS growth marketing and financial analysis contexts, adapted specifically for creative subscription businesses. All currency conversions use current live exchange rate data at the time of calculation.
FAQs About the Stock Footage Subscription Payback Period Calculator
What is the CAC payback period formula used in this calculator?
The cac payback period formula here is: Total Annual Subscription Cost divided by Monthly Net Asset Value (the revenue a customer generates from saved asset spend per month). The extended version adds the time value of monthly hours saved, converted at your hourly rate, to calculate the total payback period including both cash and time savings.
How is this different from a discounted payback period calculation?
The standard payback period does not account for the time value of money, while the discounted payback period uses a discount rate to calculate discounted cash flow over time. This tool uses a hybrid approach: it applies a real-world time-value proxy (your hourly rate) rather than a formal NPV or internal rate of return model. For subscription decisions under 12 months, the discounted payback period using a standard discount rate produces nearly identical results to the simpler formula, so the practical outcome is the same.
Can I calculate the payback period for a custom subscription not listed?
Yes. Select “Custom Subscription…” from the platform dropdown and manually enter your exact total subscription cost in the field below it. You can toggle between /year and /month billing to match your actual plan.
What does “Effective Cost Per Asset” mean in the results?
Effective cost per asset is the total annual subscription cost divided by the total assets you use in a year. It shows what each individual asset actually costs you under the flat subscription model. At high usage volumes, this figure drops to fractions of a cent (the calculator in Image 2 shows $0.01/asset), making the subscription dramatically more efficient than any individual purchase model.
Ready to see your exact numbers? Scroll back up, enter your platform and usage details, and the calculator updates your payback period and total ROI instantly.
Formula accuracy verified for standards.